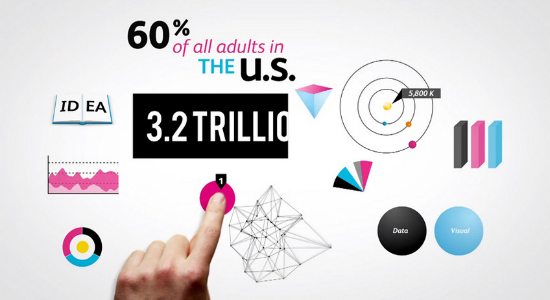
 We’re not entirely sure when it happened, but it seems like the whole internet is busy creating infographics — those image-heavy stats ensembles that bring together all kinds of facts (or possibly “facts”) and place them into more attractive surroundings.
Emma wrote this handy guide to creating your own infographics, which we’ve reproduced here for your viewing pleasure.
Sadly, she didn’t do it as an infographic — she went Old Skool and “wrote” it.
I love a good infographic. It’s such an easy way to view a whole lot of information in one glance. And if you have the skills and knowledge to create your own infographic, it can be a wonderful way to get lots of traffic and awareness of your brand out there (especially if you get featured on sites like Mashable or Social Media Today).
Resources for creating your own infographic:
Visual.ly is a brand new service that lets you create infographics without the need for extensive design knowledge. At the moment you can create a Twitter infographic of your activities, and a full service should be available soon.
Creately is a tool for creating simple diagrams and graphs as a base to your infographic. Additionally, it’s collaborative so you can create an infographic as a team effort.
I love Wordle or using words to create a beautiful visual. Enter your chosen words and it’ll create a wordy visual. Even better, you can enter your blog url or Delicious username to create an infographic of your chosen content or tags.
Variations of this article originally appeared on It’s Open and EmmaCossey.com


 Put a Pin in it: Free Pinterest Pin Cushion pattern
 Instagram It: Tiny Polaroid Magnets
 The best Tumblrs of 2012
 Google+ What is it and is it any good?
 RSS
RSS